Overview
When I first got the brief for this project, the first thing that came through my mind was an experience I had at the National Gallery in London.
Back then, I had a rough time to get around, and I immediately got interested to learn about how other people felt about their experience there, what the stakeholders where looking into, and learn more about the user's perspective at that space.
Problem statement
Young people feel anxious during their visit
Either by having uninterested peers or not having much time in town, youngsters tend to feel anxious while visiting the gallery. A sense of possibly wasting their precious vacation time and wanting to have the best possible experience can be overwhelming.
Proposed solutions

Feature #1
Quickly check tour duration options and choose the right one for you
Feature #2
Easily locate artwork, artists and exhibitions and find your way around
Feature #3
Intuitive onboard presenting features and instructions throughout the app
Understand
Stakeholders and company goals
What is the gallery currently facing?

The gallery is aiming to engage an younger audience locally
There's a lack of platform to support the experience for users locally, and there's a desire to use digital skills to win this public
Our challenge
Better understand the reason why younger users are not more present in exhibitions
How do we develop a platform that better engage the youth with this kind of spaces?
Primary research
What take our users to the gallery?
To learn about how young adults are interacting with art spaces, I looked for statistics from the England's Department for Digital, Culture, Media & Sports. From this data I had some interesting insights.
Insight from data #1
Incentivize under 60 minutes visits
Just under 40% of young adults report not having enough time as the main reason for not visiting museums or galleries.
Shorter visits are more appealing to this particular generation.
Insight from data #2
Better explore family-friendly experiences
Both spending time with family and accompanying children come up as main reasons to visit a museum.
The National Gallery lacks support for parents and children at the moment.
User interviews
What is your experience in galleries like?
Over +15 hours worth of interviews
After gathering quantitative results, I found important to get some qualitative ones. That's when I went after interviewees from our target search group.
I decided to interview three male and five female identifying young adults.

Insight from interviews
Time management is the main pain point for users
Either by having uninterested peers or not having much time in town, youngsters tend to feel anxious while visiting the gallery.
A sense of possibly wasting their precious vacation time and wanting to have the best possible experience can be overwhelming.
Empathy maps
Discover the tools used for this part of the process
After the interviews, I created empathy maps in order to easily understand and explain what I've learned from users.

Personas
Discover the tools used for this part of the process
From then, I was able to pinpoint two main personas who we should focus on for this project.
The first one being based on international young adults who are visiting the city for a limited time and the second being based on young adults who usually motivates their household to visit the gallery.
User journey maps
Discover the tools used for this part of the process
After that, user journey maps where created in order to help identify obstacle-free paths for users, highlight pain points, and identify improvement opportunities.

Define
Problem statements and hypothesis statements
User needs and propositions
In this phase, defining unspoken user's pain points and using them to form strong problem statements was a main objective, followed by hypothesis on how to design solutions to those problems.
Value proposition
From findings to features
Having in mind the previously developed research, problem statements and hypothesis statements, a list of all features and benefits came up with for my product was created. Then I moved on to answering questions such as "what does my product do?" and "why should the user care"
With these answers I was able to identify unique value propositions and filter out the ones that were not actually beneficial to the users.
Sketch
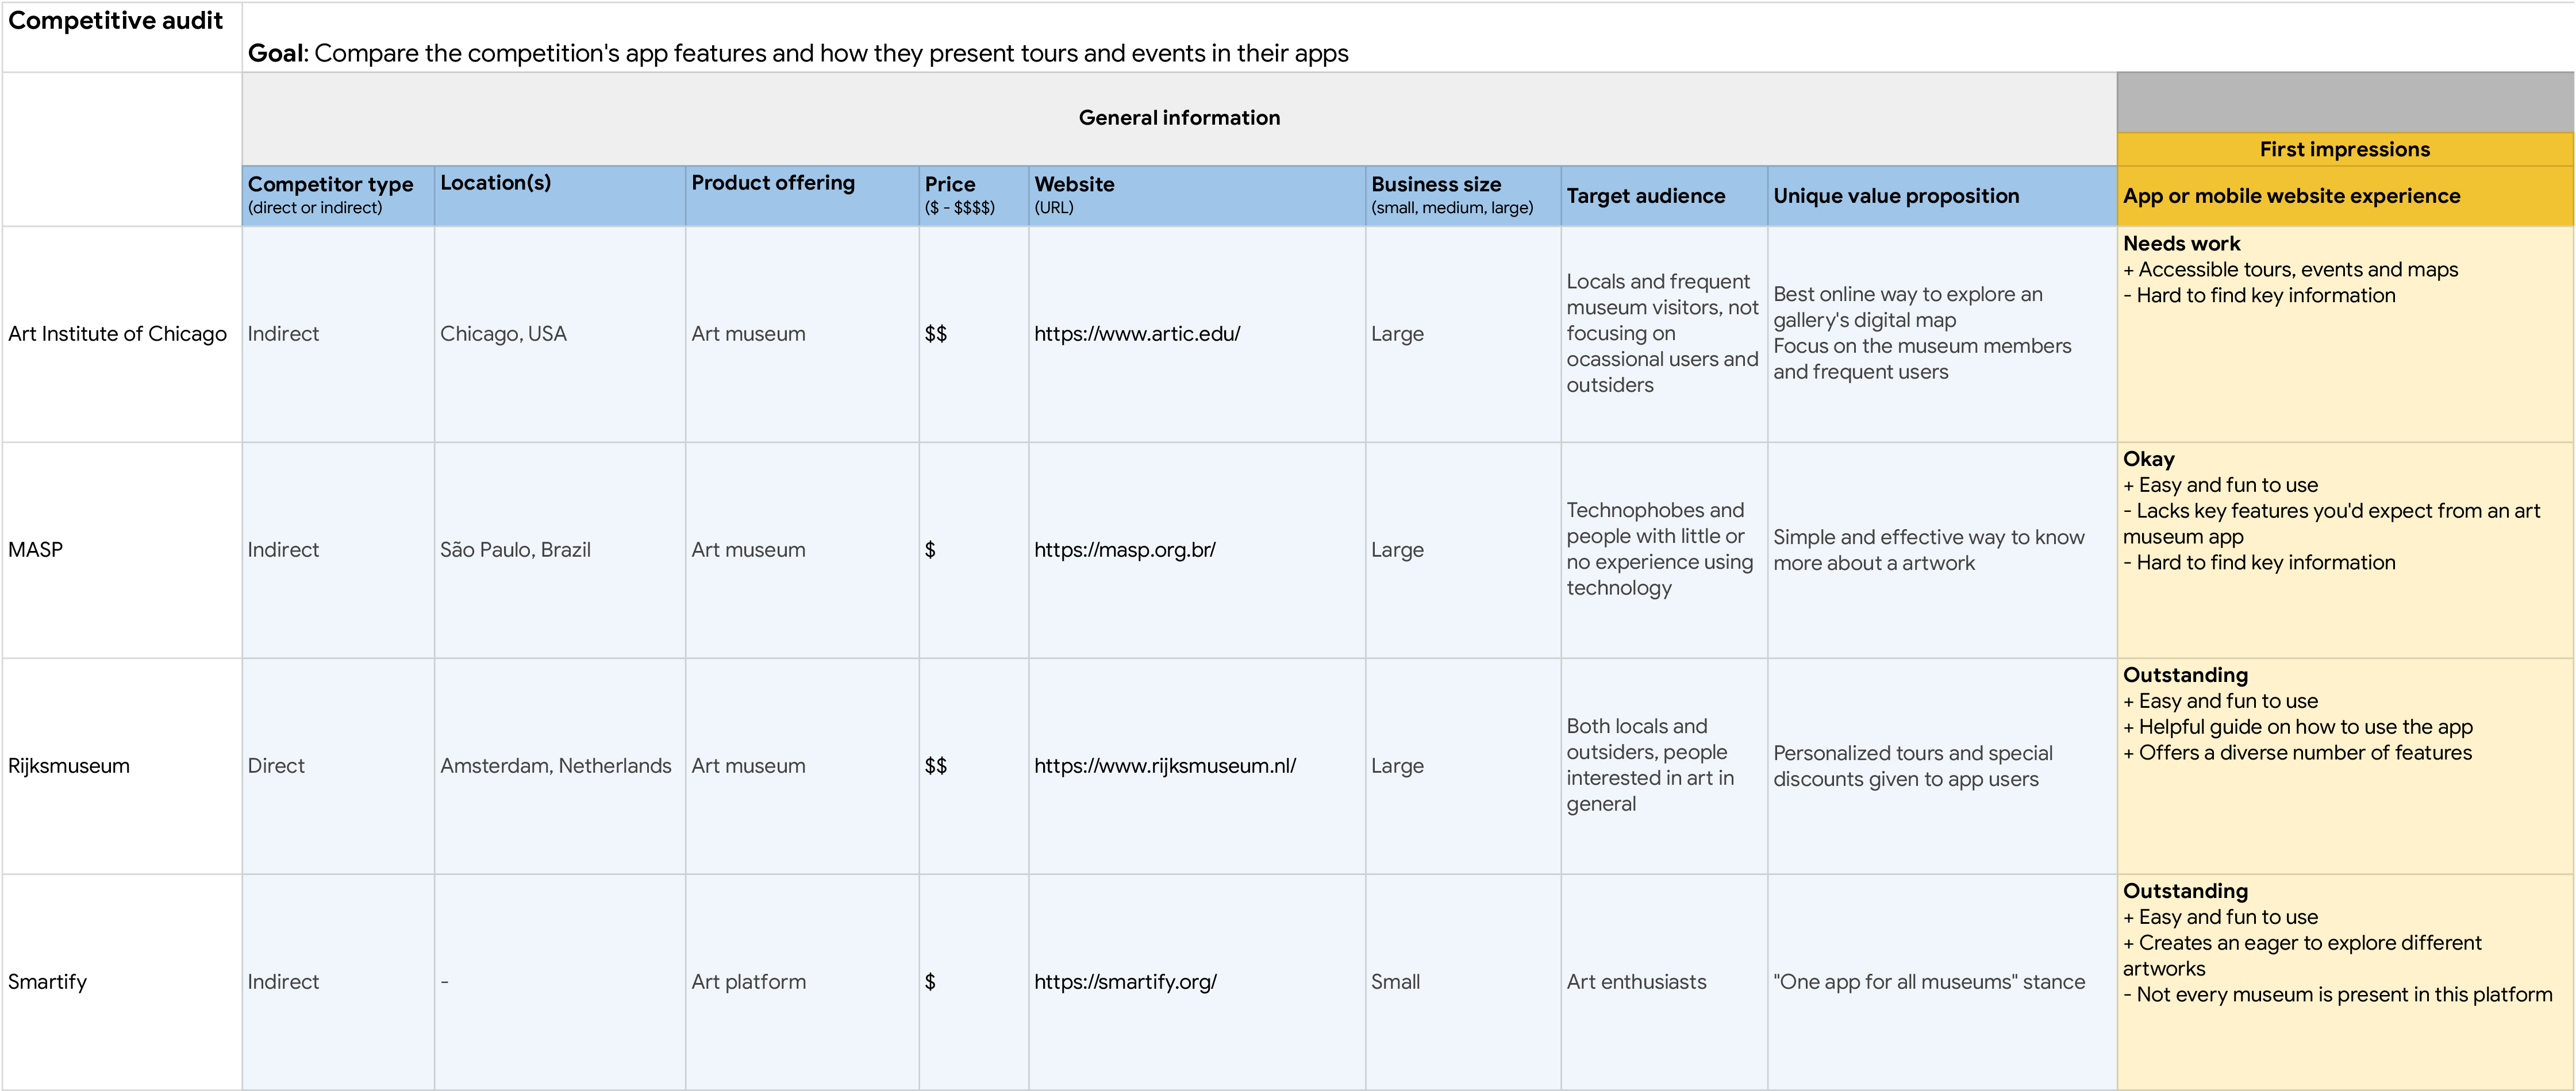
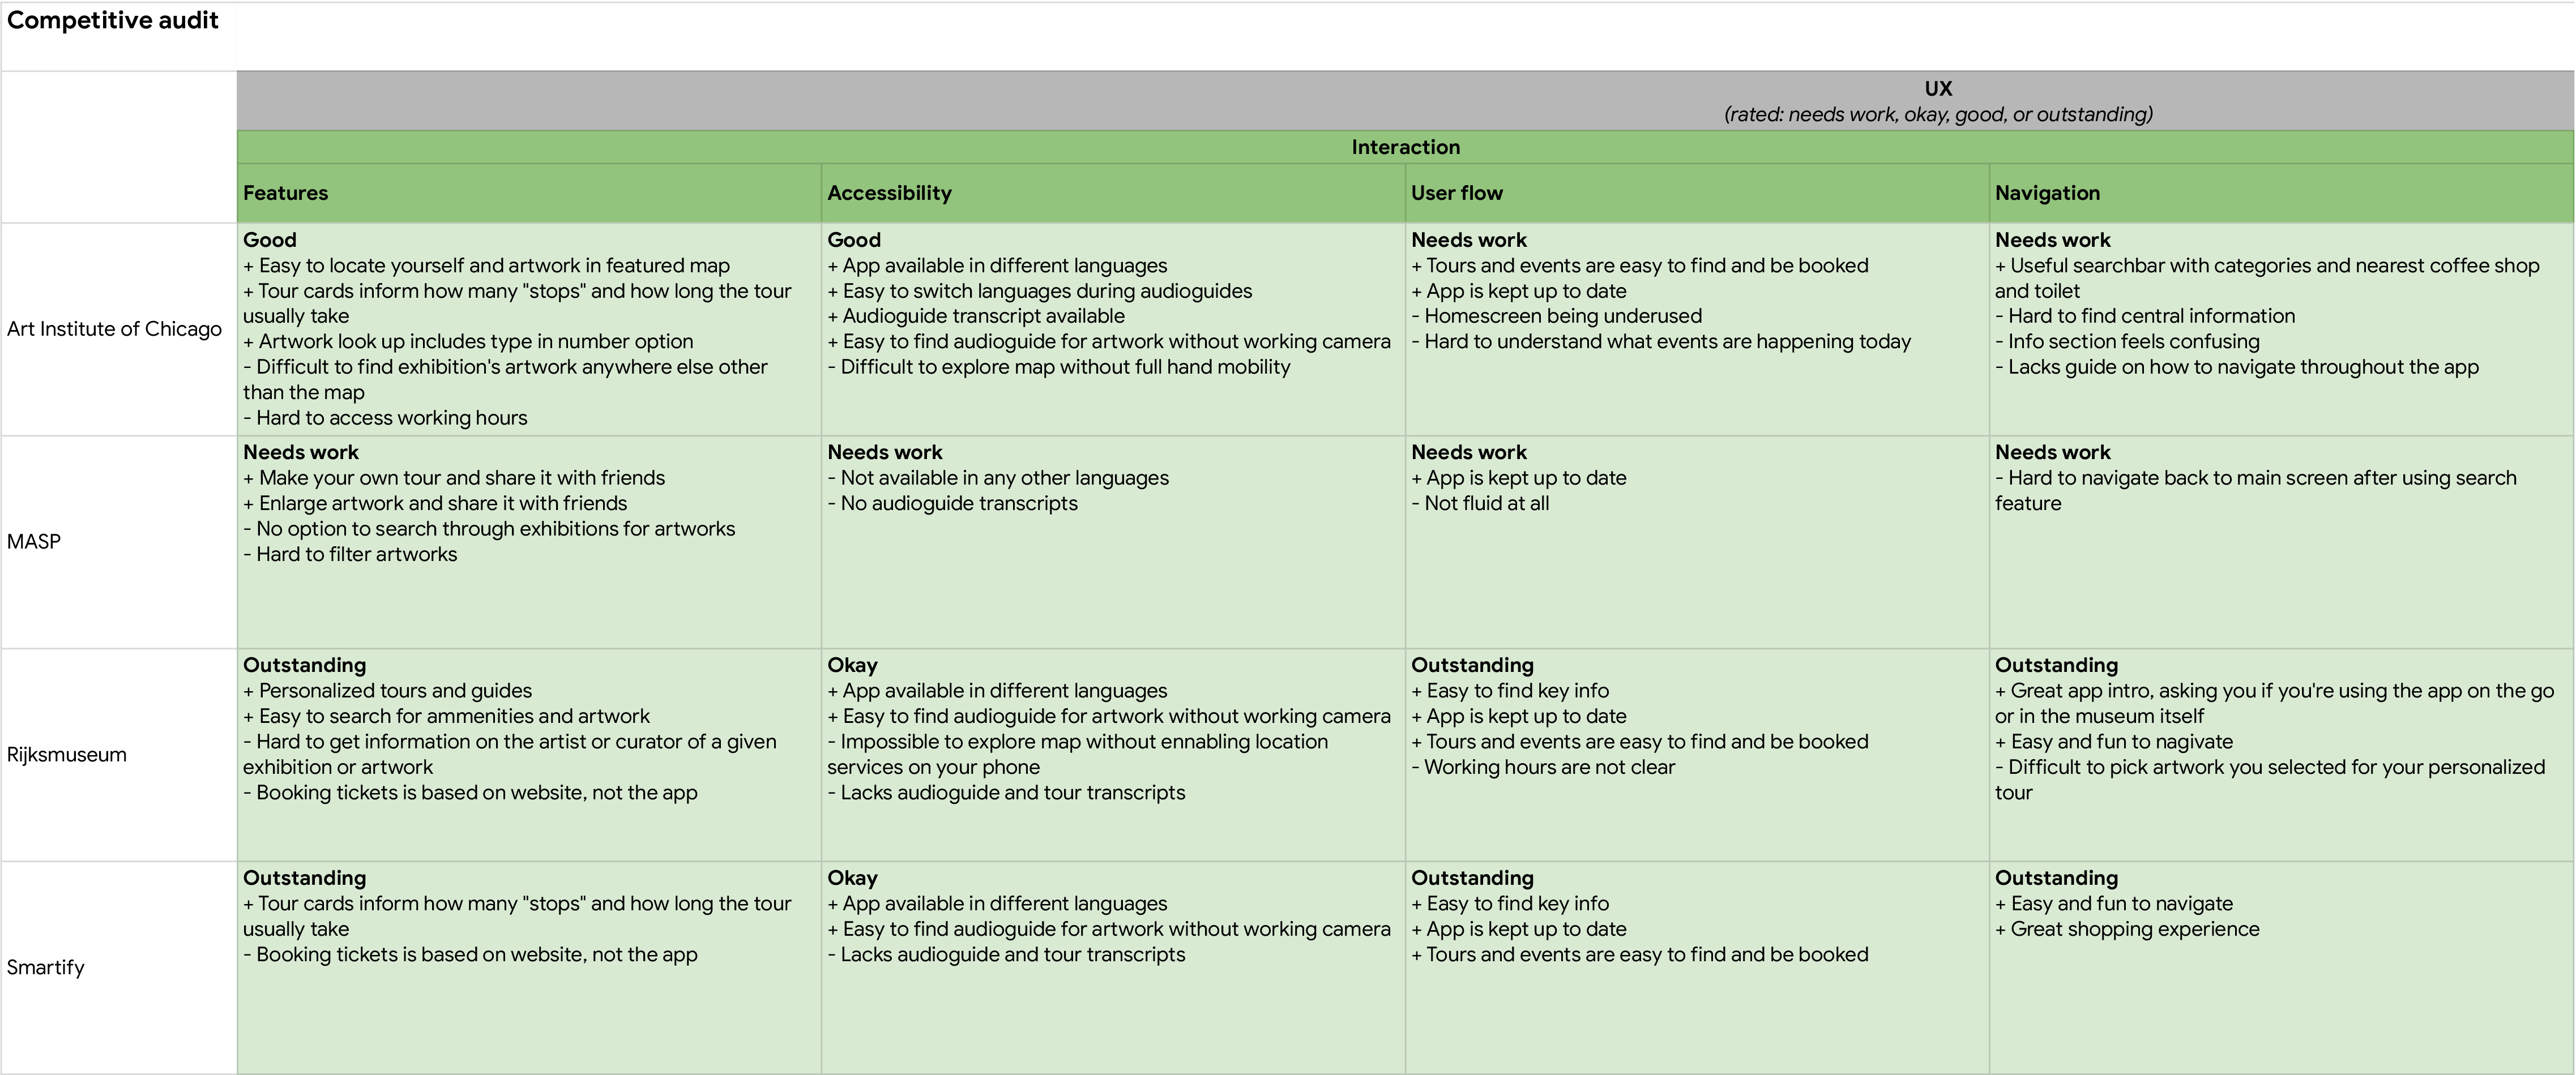
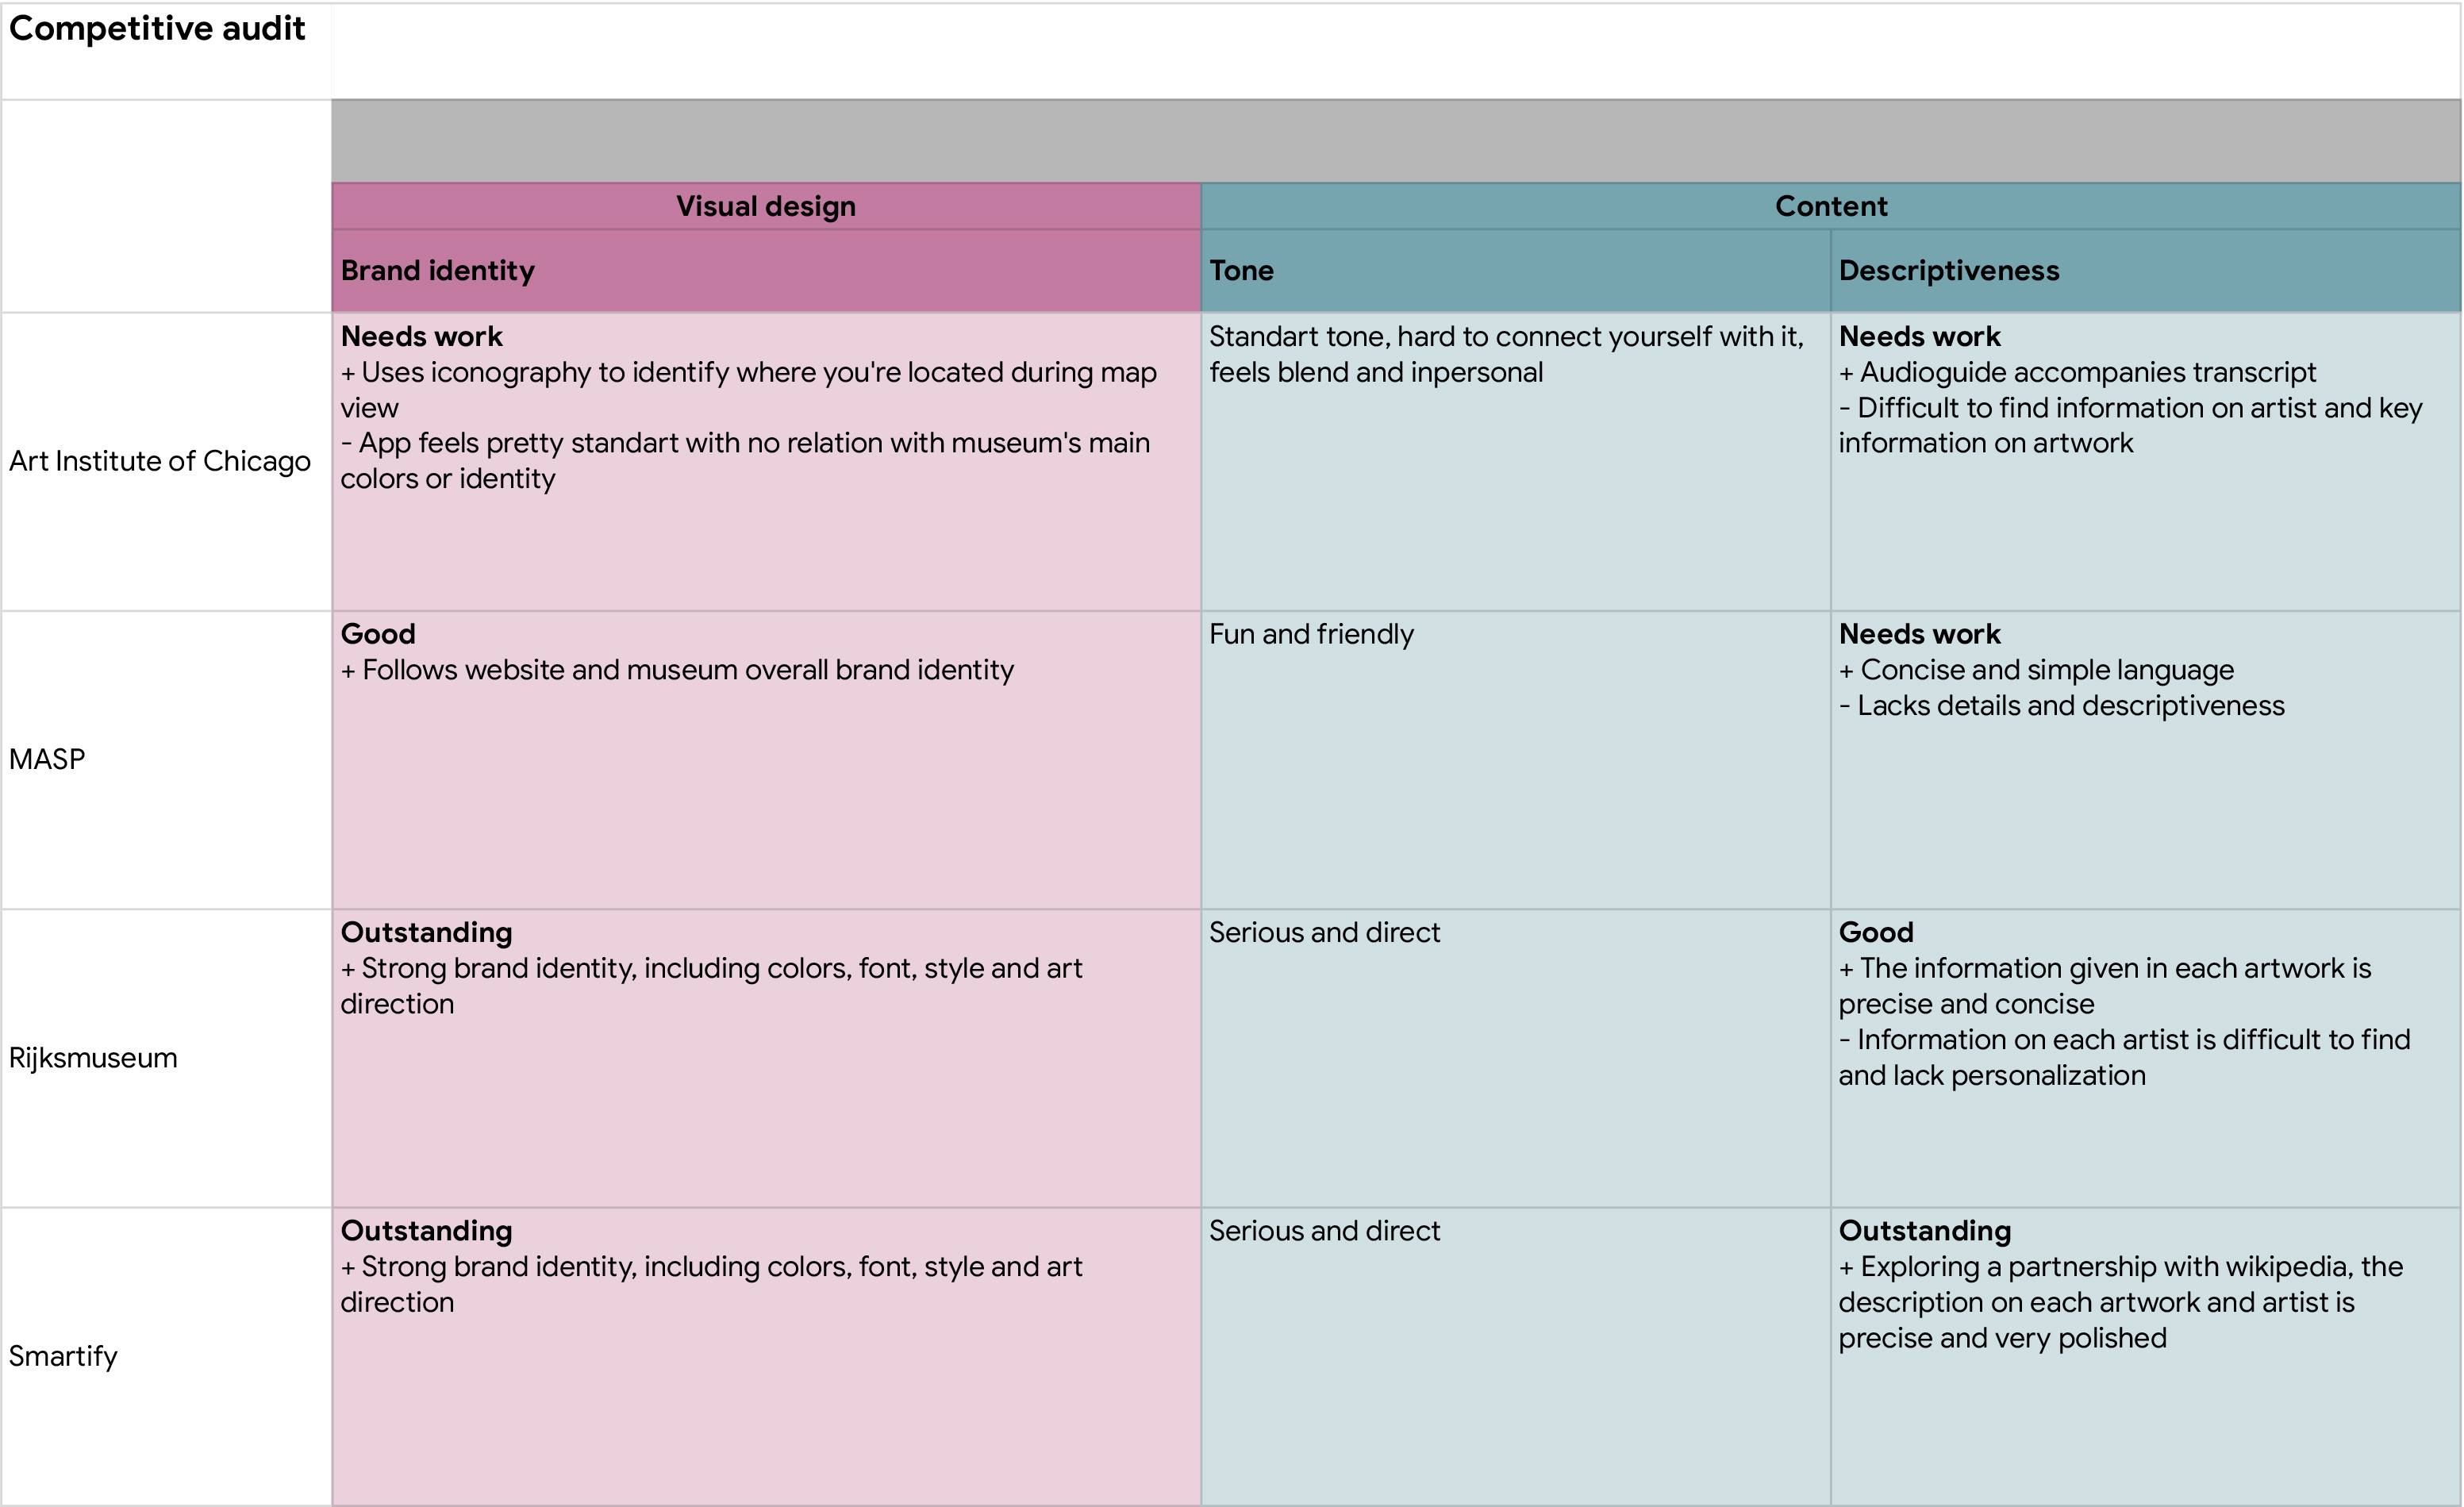
Competitive audit
Competition strengths and weaknesses
In order to build a well-rounded foundation of knowledge about the market the product will enter, I conducted a competitive audit. That knowledge was carried into my designs and helped create a product that’s helpful and unique for users.
User flow
Competition strengths and weaknesses
In sequence, to anticipate user needs when interacting with your product, user flows were created clearing and simplifying an outline for their app experience.

Storyboards
Big picture and close-up
This big picture storyboard focus on what the user needs, their context, and why the product will be useful to the user.
The close-up storyboard, on the other hand, concentrate on the product and how it works.
Information architecture
Organization, hierarchy, and sequence
The IA chart used in order to organize and sort the information that the design presents, so users can successfully experience and interact with the app.

Prototype
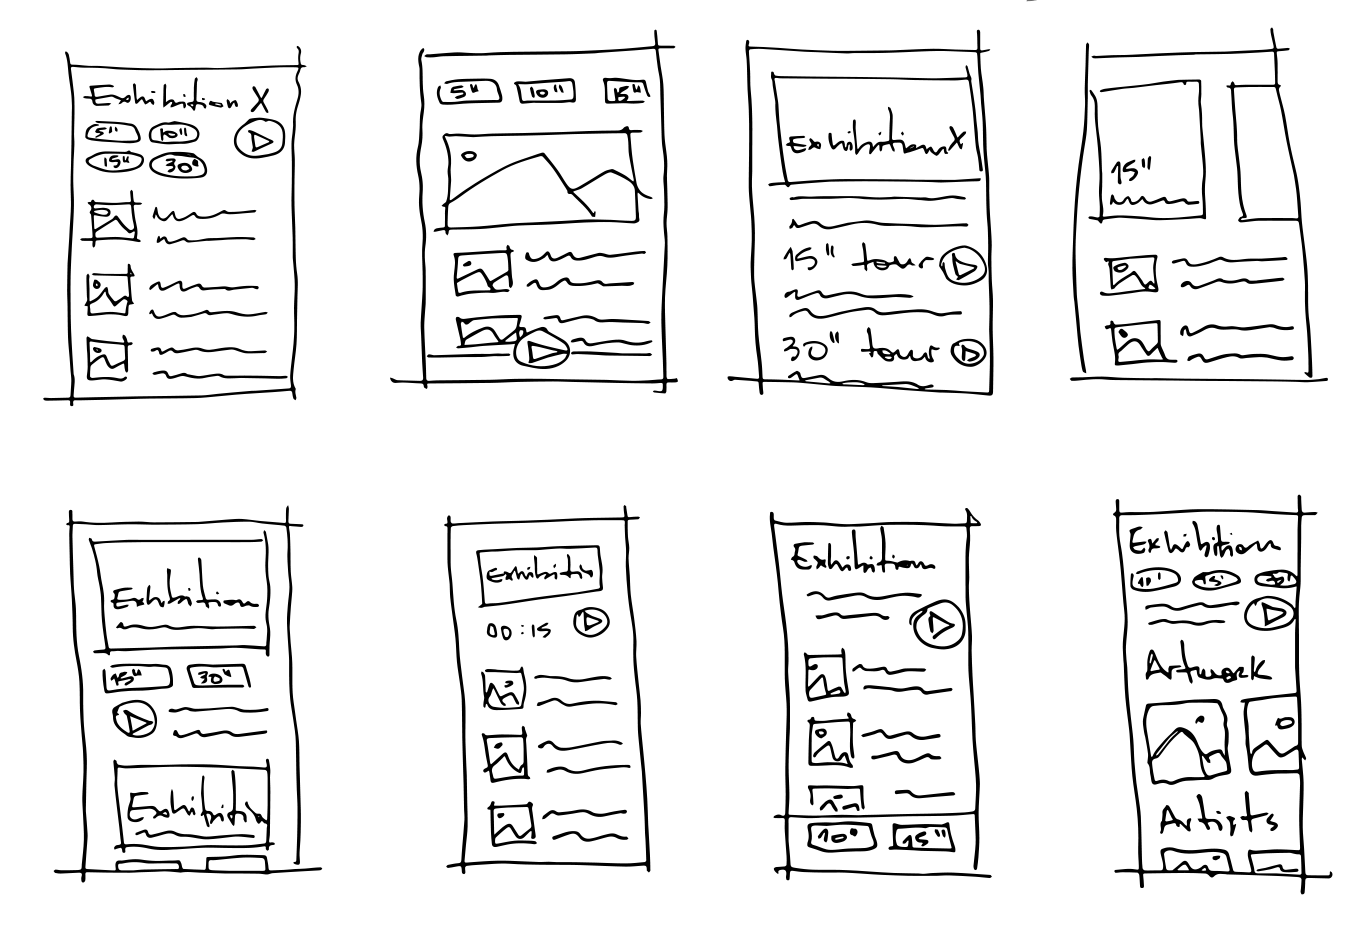
Crazy eights
Striving for better screens
Crazy Eights was the exploration method used to try and think outside the box and you have to come up with many ideas in a short time frame, without judging them. This meant to quickly develop many options for each frame and being able to nitpick qualities from different propositions.
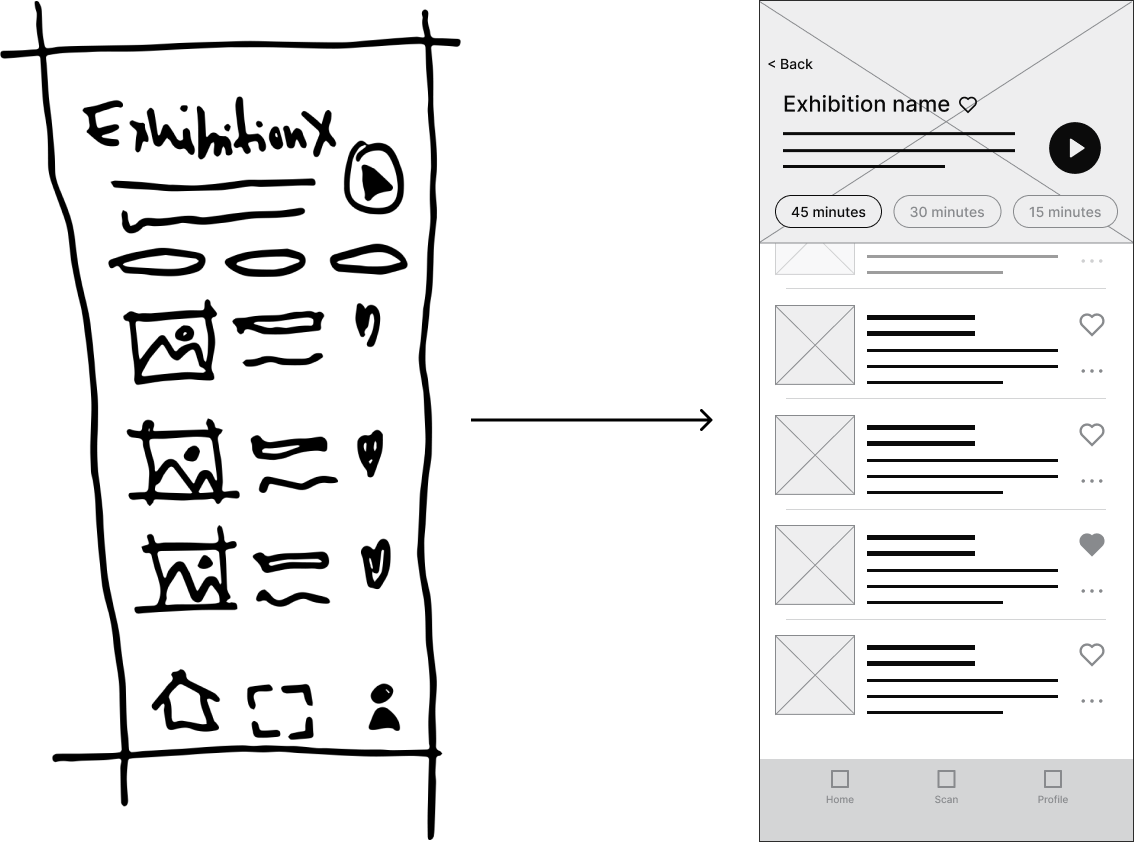
Low-fidelity wireframes
From paper to the screen
To learn about the lucky individuals tasked with building the culture of their workplace I sent a survey to a targeted set of contacts that were in HR roles. I then took the responses through a card sorting exercise to find common themes amongst the respondents.
High-fidelity wireframes
From paper to the screen
After the UI team updated the mid-fidelity prototype I animated the prototype so that it was a closer reflection of how our users would be interacting with the app.
Validate
Does it actually work?
User testing
I conducted five user testing sessions from the user's perspective as well as frame testing to ensure that the information architecture of the overall app made sense.
Some changes were then made to ensure the best usability for the users.

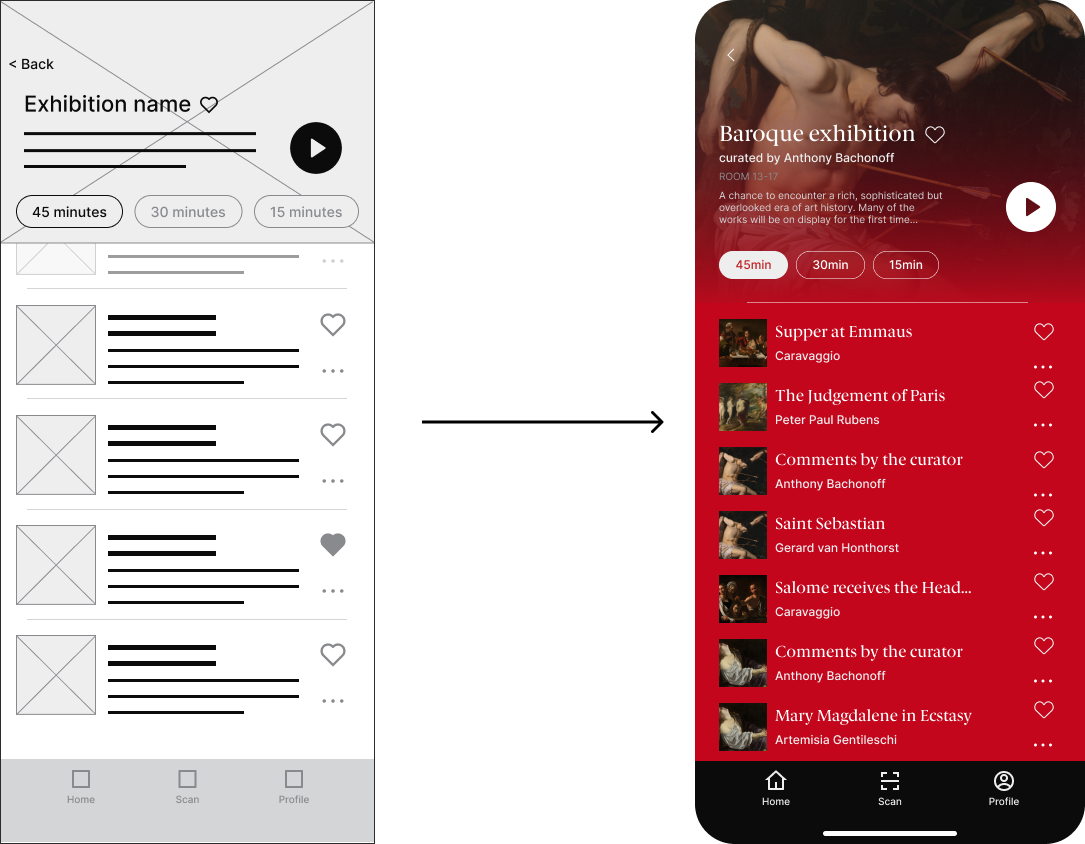
Change #1
Refined bottom navigation
After user testing, it was clear that the users benefited from different access forms to reach audioguides and artwork in geral.
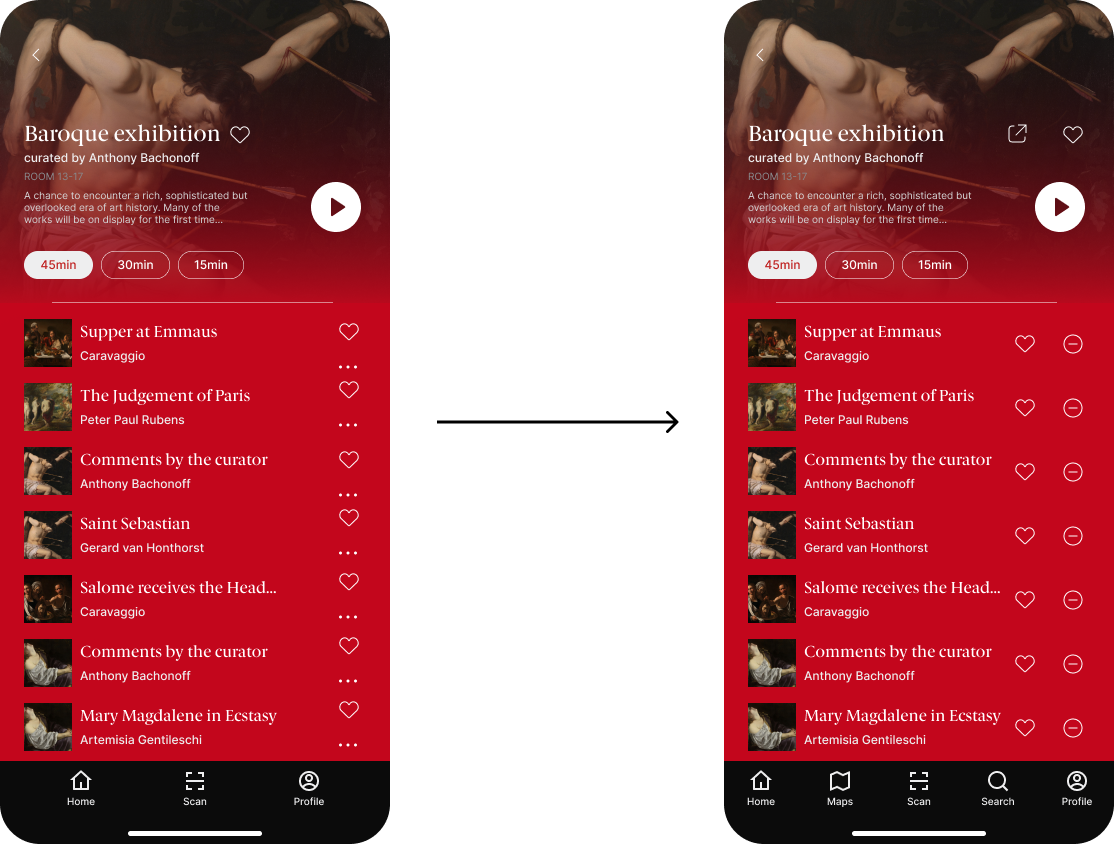
Change #2
better distributed interactions
Users had trouble engaging with some features such as liking artwork guides and being able to remove artwork from their queue.
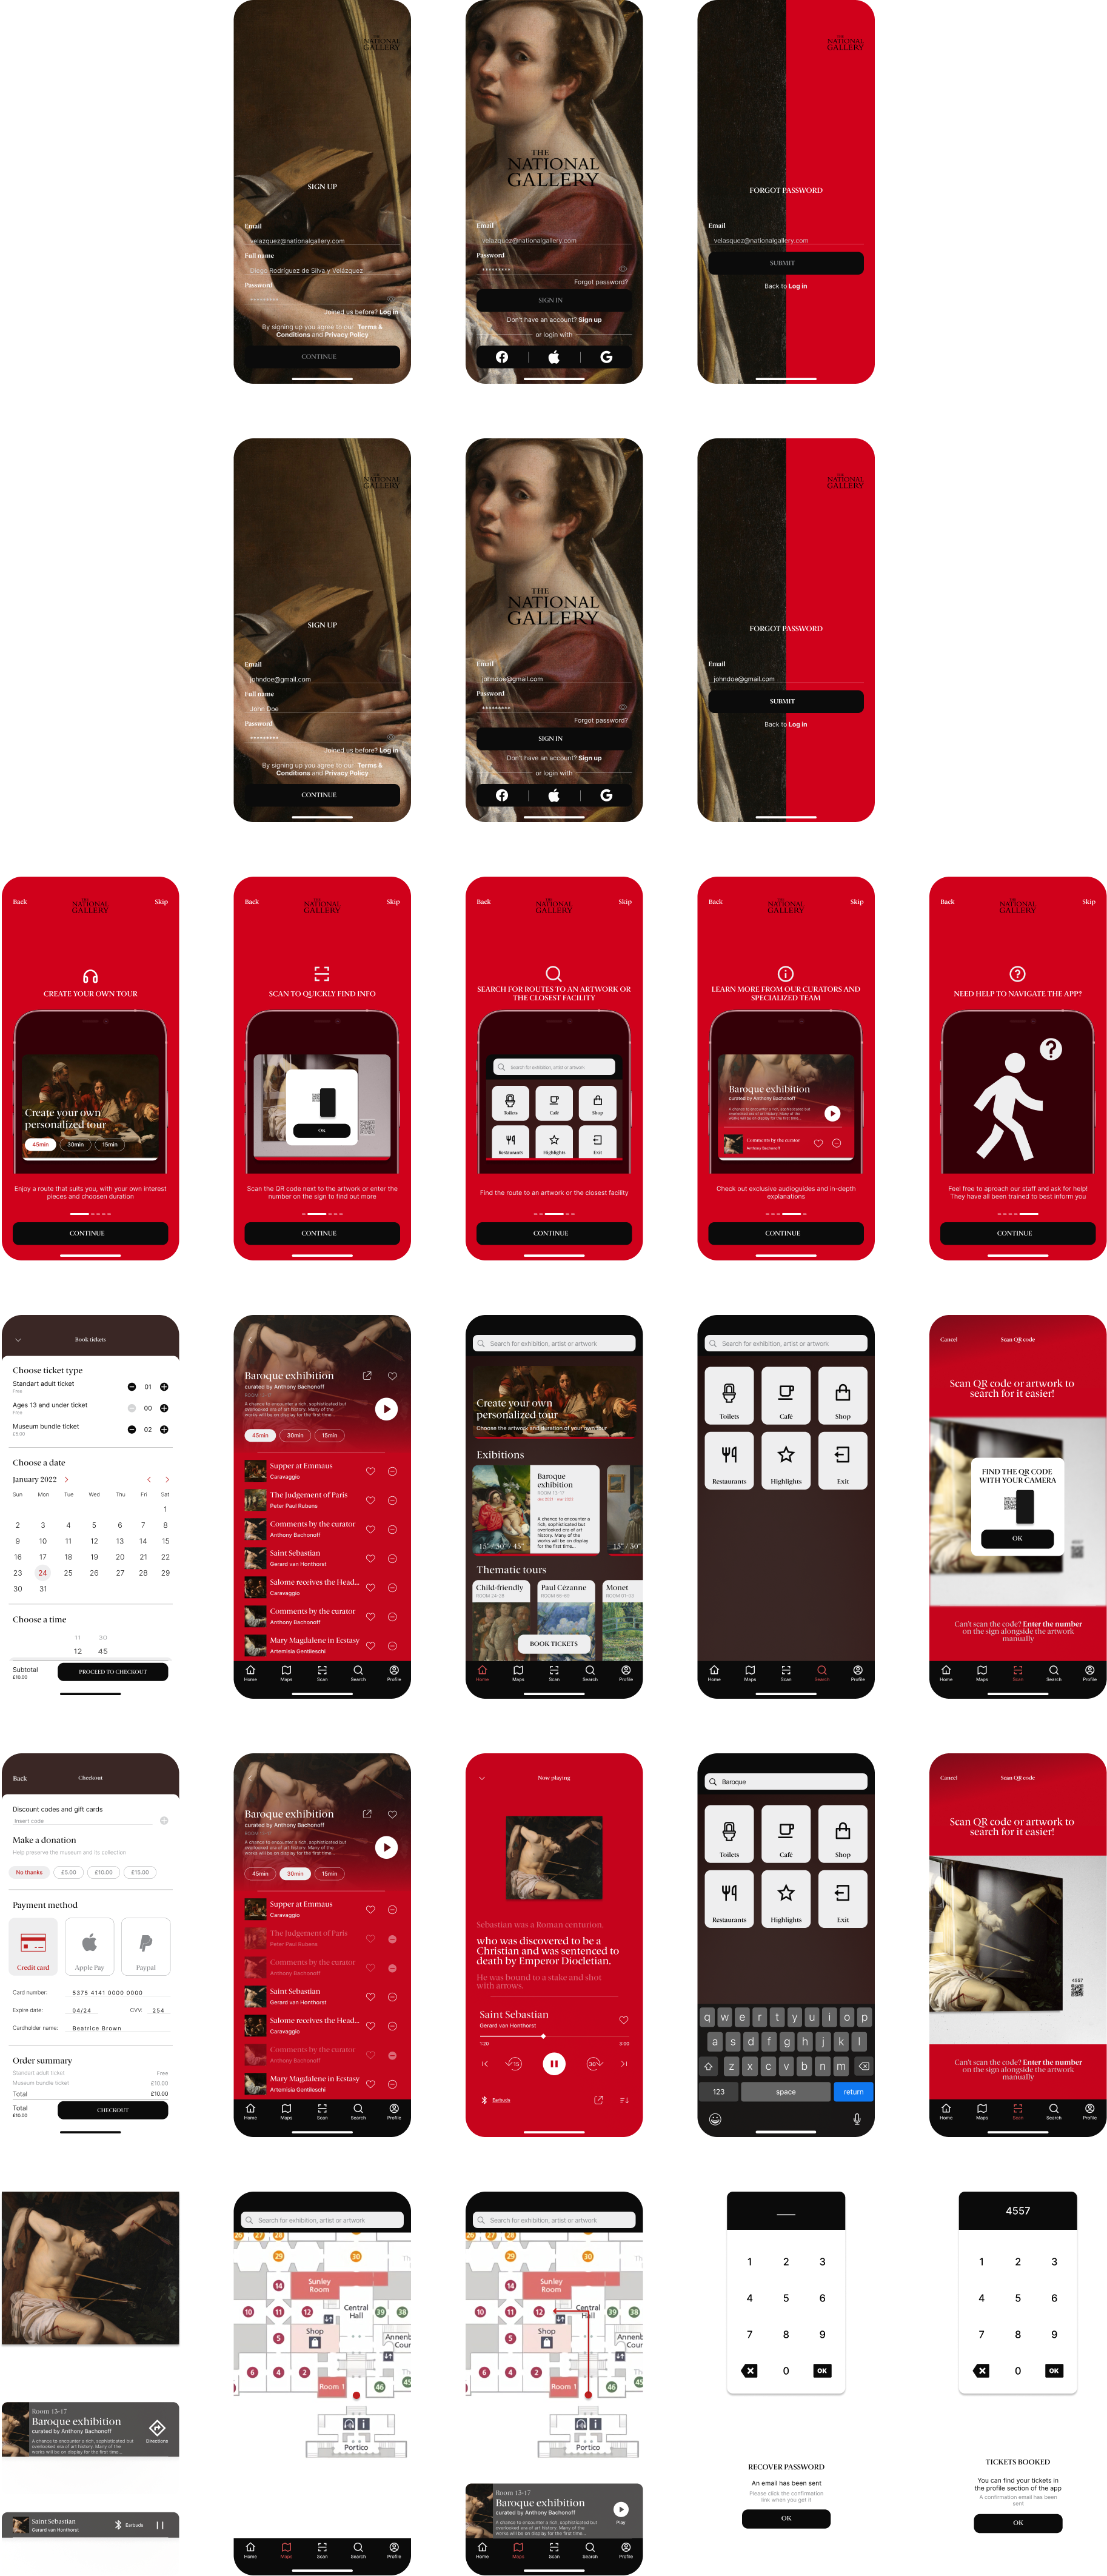
Final thoughts and frames
And that's a wrap!
In the end, I was extremely proud of the final product I'd created (30+ screens) and how far we'd come in just three weeks.
Other projects you may like
While you're here why not enjoy yourself
Musa
This project was developed with Musa, a waste management company looking to better establish their on-site survey operation.
Explore case studyInvent
Here you can have a peak on what I've worked on during my time as an UX Designer at Invent.
Request access